A Demonstrative Example of the utility of CP:
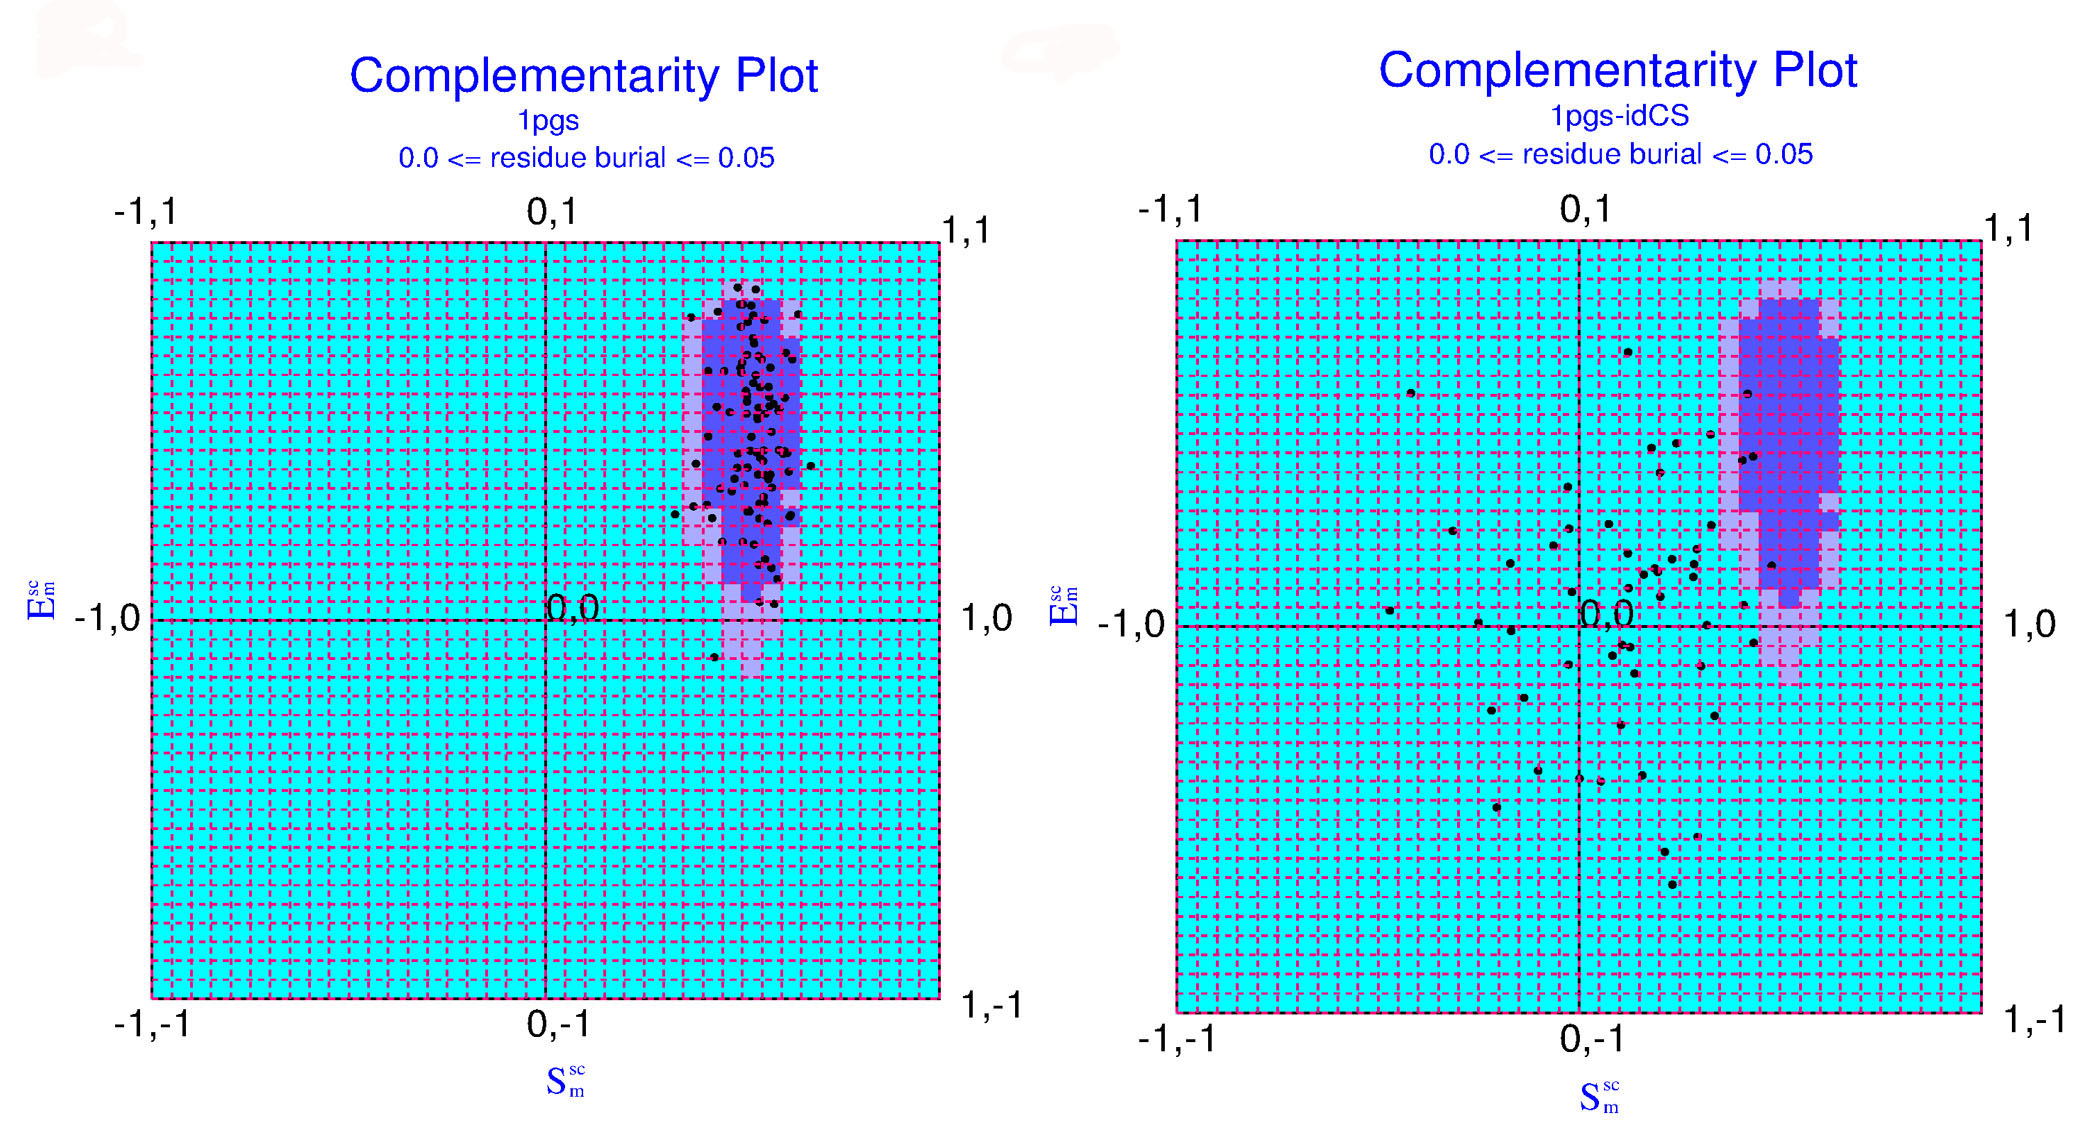
The figure shows the distribution of residues in the Complementarity Plot (CP1). For the native polypeptide chain 1PGS (Left) and its corresponding idealized structure (Right) generated utilizing CDL ideal values followed by side-chain optimization by SCWRL4.0. 'Probable', 'less probable and 'improbable' regions of the plot are colored in purple, mauve and sky-blue respectively.
Back to main page